 1:36
1:36Data quality operations
FHIR Clinical Data Normalization
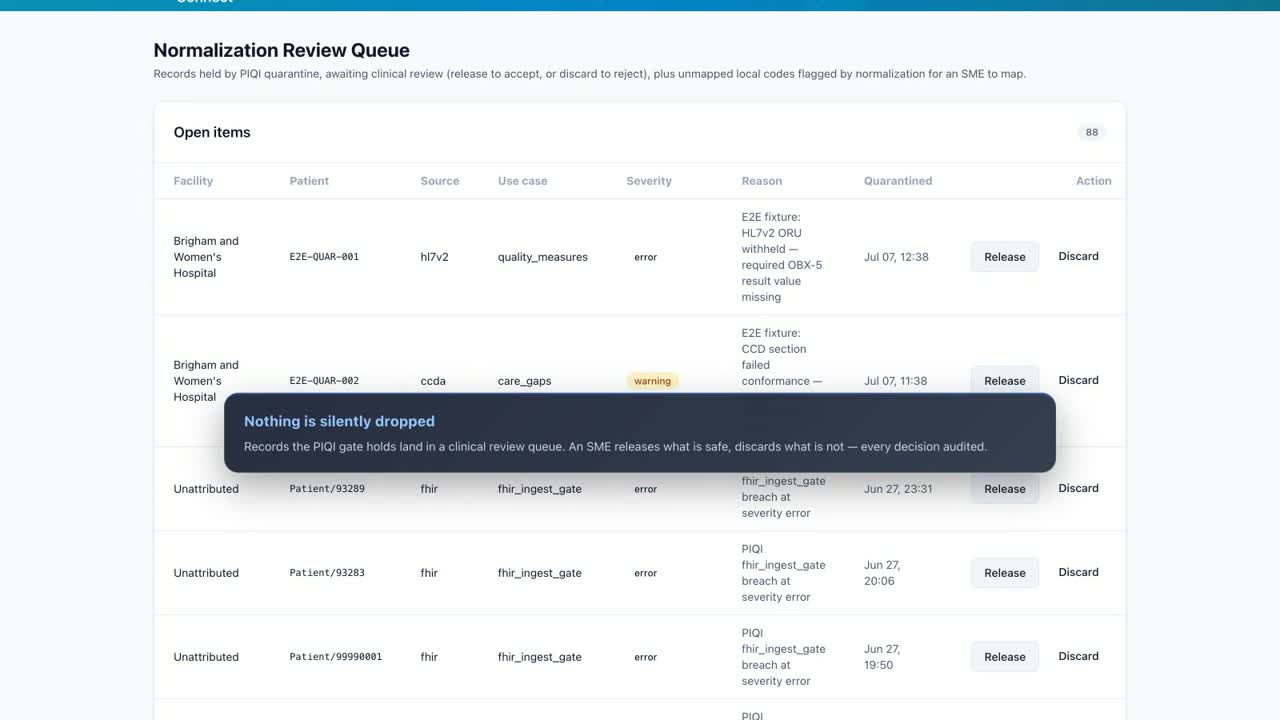
See the operational rules and expert decisions behind normalization lift.
Watch the demo →See Health-Connect score inbound healthcare data against PIQI dimensions and version-aware conformance rules, hold uncertain records for review, compare facilities, and show leadership the measured difference normalization makes.
Data quality is most useful when teams can connect a message-level defect to its operational impact. Health-Connect records PIQI accuracy, conformity, and availability signals at ingest, then rolls them up by facility and use case.
The same evidence supports conformance review, quarantine workload, facility benchmarking, and leadership reporting. Raw and normalized values remain side by side so improvement is measured instead of inferred.
Every inbound message is scored at ingest—accuracy, conformity, and availability—mapped to PIQI dimensions and rolled up per facility and use case.
Records that fail the gate are held for clinical review, not rejected. Nothing is silently dropped, and the open quarantine count is always visible.
HL7 version 2, C-CDA, and FHIR each get version-aware conformance rule packs—every message records exactly which rule set scored it.
The executive dashboard gives leadership the whole exchange at a glance—daily quality trend, normalization lift by facility, the leaderboard, and quarantine load, all built on the same rollups.
Because raw and normalized scores are kept side by side, the platform shows the measured lift normalization delivers—per facility, over time.
1:36See the operational rules and expert decisions behind normalization lift.
Watch the demo →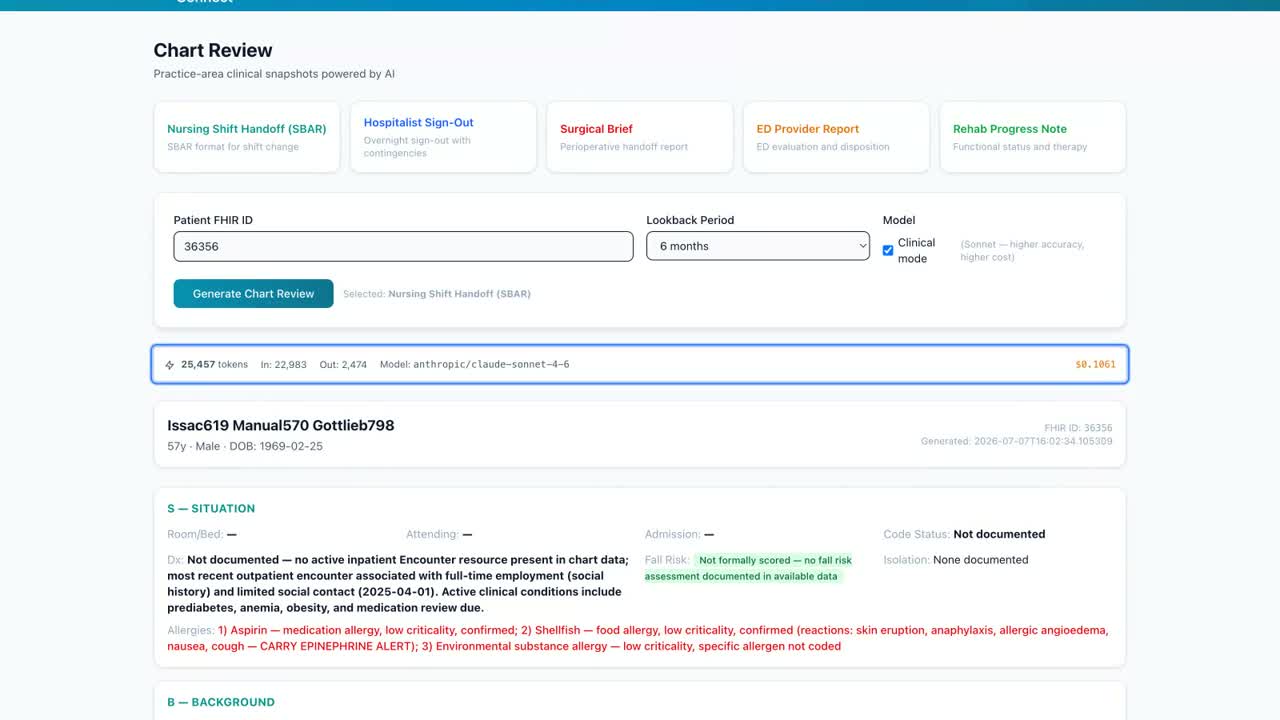 1:58
1:58Follow connected data into five audience-specific clinical summaries.
Watch the demo →